


In our previous blog post, we introduced machine learning pipelines through ZenML, and put together a simple pipeline that trains a speech recognition model.
But it wouldn’t be data science without experiments! So in this article, we’re going to talk about how to improve that model iteratively using an experiment tracker. You’ll see how to integrate experiment tracking into a ZenML pipeline, and we’ll discuss the close relationship between pipelines and experiments.
This series follows our progress building an Amazon Alexa-style digital assistant. If you want to follow along, check out the Github repo.
There are three parts to this series:
- Getting started: set up an initial pipeline that trains a minimum viable model.
- Experiments: The subject of today's post, we'll add experiment tracking to our pipeline and iterate on our model to improve its accuracy.
- Model serving: Finally we'll deploy the model as a server so it can receive audio in real-time.
What is an experiment?
Looking back, our first attempt at training a model gave us something that could tell apart two words, hello, and goodbye, with about 50% accuracy. Roughly as good as a coin flip.
While that’s not very useful in itself (and certainly a long way from our goal of building our own Alexa!) it gives us a baseline model which we can improve through experimentation. Moreover, the pipeline that we built gives us the capability to re-train the model over and over again under different conditions, helping us to figure out what works and what doesn’t.
When training ML models we rarely know at first how to solve the problems we set out to solve, so we have to figure it out through experiments. If you’ve come to data science from a background of traditional software engineering, this experimental approach can feel a bit alien, but for those coming from a science or statistics background will find it more comfortable.
A good experiment tracking solution allows us to compare models over time, identify factors that affect performance, and share experiments with colleagues for easier collaboration. Since we’re all practical people who want to build good models quickly, it’s important that the tools don’t get in our way. With that in mind, let’s look at running experiments in ZenML.
Experimenting with ZenML
In this section we’re going to introduce a new tool, MLFLow, which integrates into our ZenML pipeline to track experiments. It’s worth noting MLFlow isn’t only an experiment tracking tool. It does a few things besides that, including model serving, which we’ll tackle in the next blog post.
As a reminder, here is what our pipeline looks like:
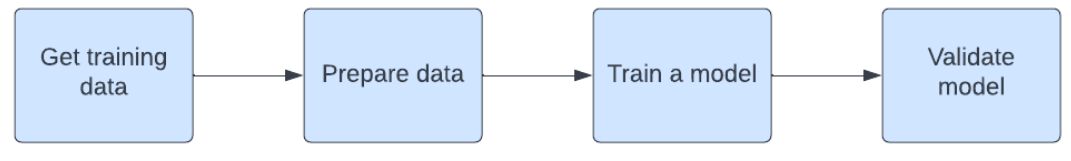
Pipelines and experiments
Any experiment starts with a hypothesis. An example might be “if we have more hidden layers, we’ll get better accuracy”. To test a hypothesis, we run the pipeline and make a record of what the pipeline did, plus how the model performed.
ZenML itself already keeps track of every pipeline run. It records:
- When it ran,
- The training configuration - such as the number of epochs,
- Performance metrics like accuracy against the validation dataset.
So you might wonder what an experiment tracker actually gives us over and above this kind of pipeline logging. There are two key differences:
Runs vs experiments: while every experiment is a pipeline run, not all pipeline runs are experiments. An experiment has a specific hypothesis that we want to test, but a pipeline run covers any situation where we want to train a model, not only for the purposes of an experiment.
Details: an experiment tracker records a much richer set of detail about pipeline runs. In principle we can record anything we want; in practice we often record accuracy and loss for every training epoch, alongside the code and data versions, and any training parameters that went into the experiment.
The Zen moment (excuse the pun) is realising how intimately connected pipelines and experiments are. Pipelines enable us to go fast on experiments, because we can change just one thing and be confident that everything else will be the same as it was before.
At the same time, experiments without pipelines are just messy. While it's easy to simply experiment through a notebook, pipelines are reproducible, giving our experiments rigour.
Using MLFlow
We remarked before on how ZenML’s design enables us to defer some implementation decisions until later on. Because of this, adding MLFLow experiment tracking to our existing pipeline turns out to be pretty straightforward.
First, we need to install MLFlow. With ZenML, we can install it as an integration<pre><code>
zenml integration install mlflow
</code></pre>
Next, we’re going to add MLFlow to two of our pipeline steps: the train and evaluate. That looks roughly as follows:<pre><code>@enable_mlflow
@step(enable_cache=True)
def lstm_trainer(config: LSTMConfig, X_train: np.ndarray, y_train: np.ndarray, context: StepContext, timesteps: int) -> Model:
model = Sequential()
# ...
mlflow.tensorflow.autolog()
model.fit(X_train, y_train, epochs=config.epochs, batch_size=config.batch_size)
@enable_mlflow
@step
def keras_evaluator(X_test: np.ndarray, y_test: np.ndarray, model: tf.keras.Model) -> Output(. . .):
accuracy, loss = model.evaluate(X_test, y_test, verbose=2)
mlflow.log_metric("Testing Accuracy", accuracy)
return accuracy, loss
</code></pre>
There are a couple of things to highlight in the above. As you can see, we need to add a new decorator to any step where we want to use MLFlow. Usually, we won’t want experiment tracking on every step of the pipeline, so we only add it where it’s relevant.
The second observation is not ZenML-specific. MLFlow provides us with two ways of passing information about an experiment: the TensorFlow autolog function captures all the details about the training process as it happens, recording performance in each training epoch. And then we can explicitly pass it additional metrics, which is done above when we want to record the accuracy against the test dataset.
Running an experiment
With a few alterations to the code, as seen above, we’re ready to run an experiment. Typically we want to provide certain parameters to the pipeline so we can observe the outcome. The simplest way to do this is on the command line, like so:<pre><code>
python pipeline/run.py --epochs 20 --batch_size 5
</code></pre>
This example is relatively straightforward but serves to illustrate the idea: we’ve set a specific number of epochs and a specific training batch size. We can imagine more complex examples, like changing how many layers we've got in our neural network, and things like that.
MLFlow gives us a user interface where we can explore experiments. In the screenshot below we have a list of example experiments:
.png)
Each recorded experiment has a time, duration, the user who ran it, code and data versions, model assets, and metrics, including the train and test accuracy, alongside our training parameters, which in this case is the batch size and number of epochs.
Below, we can see an individual experiment. We train our neural network model over multiple epochs, and the graph below shows the training loss at every epoch. By drilling into this kind of detail, the experiment tracker helps us to understand not only the final model performance but also how we arrived at that result.

What we've demonstrated above represents the very basics of experiment tracking, and there's a lot more engineering that goes into experimentation that we haven't discussed here, such as picking the right metrics for evaluating model performance.
But as far as getting started goes, the magic of ZenML allows us to bring together the best tools to achieve our goals through 3rd party integrations like MLFlow.
What’s next?
In this blog we’ve discussed how to add experiment tracking to a ZenML pipeline with the help of MLFlow. With a little bit of tooling, we're now equipped to iterate quickly on the model, focusing on the minute details that will improve its performance.
In the next article, we’ll be adding model serving capabilities to our pipeline. This will allow us to get real-time inferences from our model; that is, we can provide it with a recorded command, and it will decide what the command is. By then, we’ll have built an end-to-end proof of concept for a smart assistant.


Sign up to our newsletter

Heron House
1 Lincoln Square, Manchester
England, M2 5LN
0161 533 0337